Kroki provides a unified API to create diagrams from any of the following libraries:
Creates diagrams from textual descriptions!
Kroki provides a unified API to create diagrams from any of the following libraries:
Try#
Features#
- Ready to use
- Diagrams libraries are written in a variety of languages: Haskell, Python, JavaScript, Go, PHP, Java... some also have C bindings. Trust us, you have better things to do than install all the requirements to use them. Get started in no time!
- Simple
- Kroki provides a unified API for all the diagram libraries. Learn once use diagrams anywhere!
- Free & Open source
- All the code is available on GitHub and our goal is to provide Kroki as a free service.
- Fast
- Built using a modern architecture, Kroki offers great performance.
Examples#
A quick look at what Kroki can render, from UML to hand-drawn ASCII art.

Use case diagram
PlantUML

Entity Relationship Diagram
Erd

Gantt chart
Mermaid

Hardware structure
Symbolator

Ascii Art
Svgbob

Impossible trident
Pikchr
Diagram types#
The following diagram types and output formats are available:
BlockDiag
pngsvgpdf
BPMN
svg
Bytefield
svg
SeqDiag
pngsvgpdf
ActDiag
pngsvgpdf
NwDiag
pngsvgpdf
PacketDiag
pngsvgpdf
RackDiag
pngsvgpdf
C4 with PlantUML
pngsvgpdftxtbase64
D2
svg
DBML
svg
Ditaa
pngsvg
Erd
pngsvgjpegpdf
Excalidraw
svg
GoAT
svg
GraphViz
pngsvgjpegpdf
Mermaid
pngsvg
Nomnoml
svg
Pikchr
svg
PlantUML
pngsvgpdftxtbase64
Structurizr
pngsvgpdftxtbase64
Svgbob
svg
Symbolator
svg
TikZ
pngsvgjpegpdf
UMlet
pngsvgjpeg
Vega
pngsvgpdf
Vega-Lite
pngsvgpdf
WaveDrom
svg
WireViz
pngsvg
You don't see your favorite diagram tool in this list, please let us know 👋 [email protected].
Cheat sheet#
Every diagram type, its formats and the URL slug, on one page — generated straight from the catalog above, so it's always current.
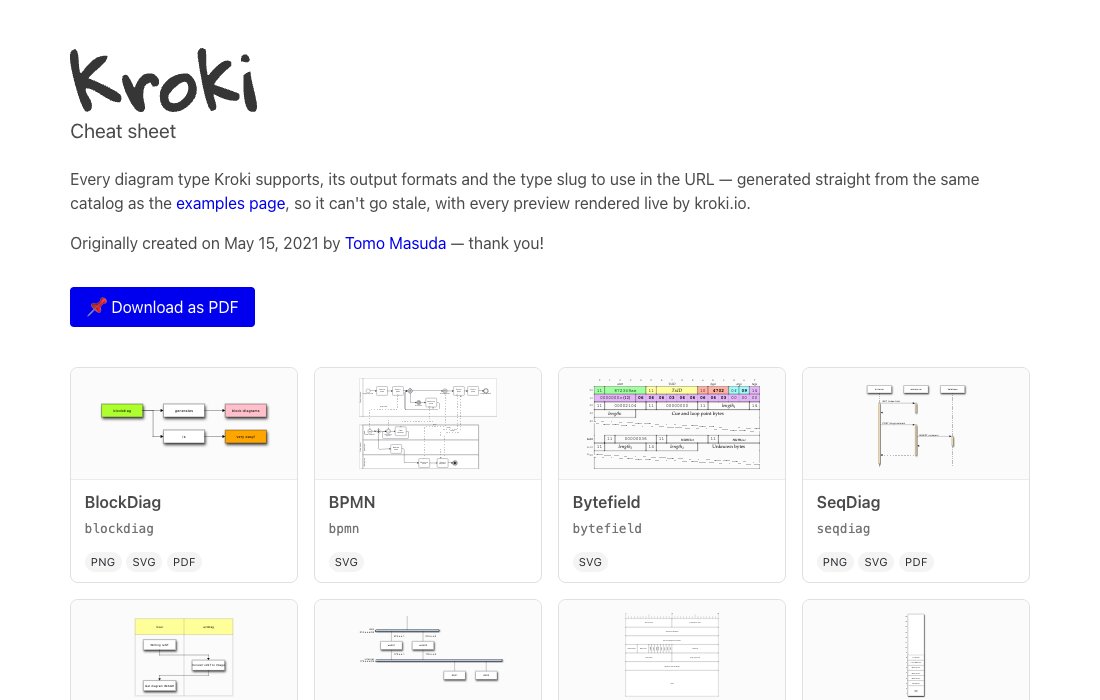
Browse the cheat sheet
PDF
Install#
Kroki is available as a Free Service and as a Self-Managed instance.
Self-Managed
Select this option if you want to download and install Kroki on your own infrastructure or in a cloud environment.
Please refer to the documentation to install Kroki.
Free service
Thanks to Exoscale, which has kindly offered two servers,
we can provide Kroki as a free service!
However, some parts of the infrastructure are still host on other providers, so we are still looking for sponsors to cover all the
expenses.
If you are interested, please 👋 contact us.
How#
Kroki provides an HTTP API to create diagrams from textual descriptions.
Kroki handles both GET and POST requests.
When using GET requests, your diagram must be encoded in the URL using a deflate + base64 algorithm.
But don't worry, if you're not familiar with deflate or base64 (or if you don't want to use them),
you can also send your diagram as plain text using POST requests (see below).
Let's take an example with a GraphViz "Hello World":
hello.dot
digraph G {Hello->World}Here, we are using a Python one-liner to encode our diagram using deflate + base64:
cat hello.dot | python -c "import sys; import base64; import zlib; print(base64.urlsafe_b64encode(zlib.compress(sys.stdin.read().encode('utf-8'), 9)).decode('ascii'))"The above command will return a value that you can copy and paste at the end of the URL:
GET /graphviz/svg/eNpLyUwvSizIUHBXqPZIzcnJ17ULzy_KSanlAgB1EAjQAnd here's the result:
Please note that the encoding process is lossless. As a matter of fact, you can also use a Python one-liner to decode an encoded diagram:
echo "eNpLyUwvSizIUHBXqPZIzcnJ17ULzy_KSanlAgB1EAjQ" | python -c "import sys; import base64; import zlib; print(zlib.decompress(base64.urlsafe_b64decode(sys.stdin.read())).decode('utf8'))"The above command will return:
digraph G {Hello->World}POST requests#
You can also call Kroki with POST:
POST /{
"diagram_source": "digraph G {Hello->World}",
"diagram_type": "graphviz",
"output_format": "svg"
}In this case, you don't need to encode your diagram.
It's also possible to send your diagram as plain text using the Content-Type header.
The output format will be specified using the Accept header and the diagram source will be sent as the request body:
POST /graphvizAccept: image/svg+xml
Content-Type: text/plain

digraph G {
  Hello->World
}
You can also define the output format in the URL if you don't want to add an Accept header:
POST /graphviz/svgContent-Type: text/plain
digraph G {
Hello->World
}
The same concept applies when sending the diagram as JSON:
POST /graphviz/svg{
"diagram_source": "digraph G {Hello->World}"
}
Please note that you can interact with the API using any HTTP client.
If you want to learn more, head to our documentation.
In particular, check out the Usage section to find out how
to send requests to the Kroki API using:
Sponsors#
Thanks to our sponsors listed below, we are able to provide Kroki as a free service available to everyone.
-
 A solid European cloud hosting alternative.
-
 The diagramming tool for developers.
-
 An open-source modern team chat app designed to keep both live and asynchronous conversations organized.
-
 Utilities and tools to integrate Amazon Web Services (AWS) with Atlassian products.
Sponsors play a critical role, without them, we won't be able to provide Kroki as a free service.
To make Kroki sustainable, we need your support.
If you want to become a sponsor, please 👋 contact us.
About#
Kroki is a free service built and maintained by Yuzu tech and supported by Exoscale.
Kroki is an open source project licensed under the MIT license.
This means that Kroki is never going away; anyone can host this service with minimal resource requirements.